
Introduction
Have you ever wondered which topics people actually search for, which posts get more saves and shares, or which blog posts bring more enquiries?
These are the kinds of questions I started paying more attention to when I began using data to plan content.
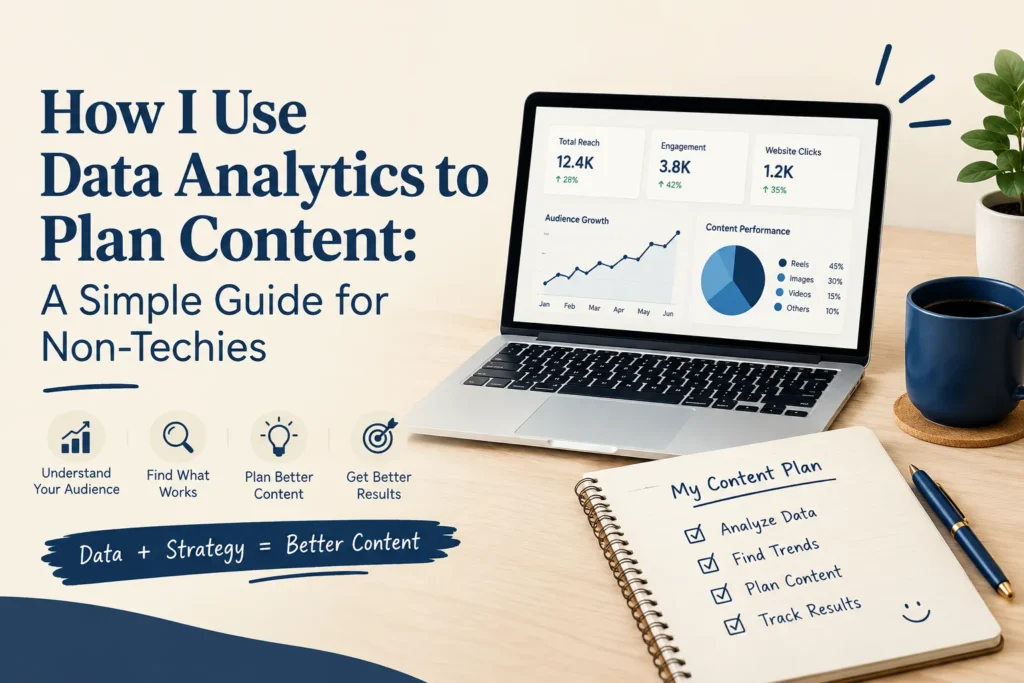
In this blog, I’ll share a simple process for planning content using data with basic tools, no coding, and no complicated spreadsheets.
You’ll learn how to spot useful content opportunities, understand what your audience responds to, and use those insights to plan your next posts with more confidence.
The goal isn’t to analyse every number. It’s to reduce guesswork, spend less time creating content that doesn’t connect with your audience, and gradually build a content plan around what you learn.
This approach can be useful for small businesses in Kannur and across Kerala that want to understand their audience better, improve their content, and turn their content efforts into meaningful results over time.
Why I Started Using Data for Content Planning
Content planning can easily turn into a guessing game.
You might think:
“This topic will probably perform well.”
“People will like this Reel.”
“This is trending, so we should post about it.”
“Our audience is active at this time.”
Sometimes those assumptions are right.
Sometimes they aren’t.
That’s where data can help.
My background in Computer Science and Data Analytics changed the way I look at content. Instead of relying only on assumptions, I started looking for simple signals that could answer questions like:
What are people interested in?
Which topics get more attention?
Which content gets saved or shared?
Which pages bring visitors?
Which content leads to enquiries?
You don’t need to become a data analyst to start doing this.
You simply need to get into the habit of looking at what happens after you publish.
What Does “Data-Driven Content” Actually Mean?
Data-driven content simply means using the information you already have to make better content decisions.
Instead of only asking:
“What should I post?”
you can also ask:
“What does my audience seem interested in?”
For example, data can help you decide:
What topics to create
Which platform to use
What type of content to make
Which topics are worth exploring further
What you could improve next month
And data doesn’t always mean a huge Excel sheet.
Sometimes it’s as simple as noticing that:
One topic gets more saves
One Reel gets more shares
One blog gets more visitors
The same question keeps appearing in your DMs
These small observations can give you useful clues about what your audience wants.
Start With a Clear Goal
Before looking at numbers, first decide what you want your content to achieve.
Your goal could be to:
Increase awareness
Bring more visitors to your website
Generate enquiries
Increase product interest
Build trust
Educate customers
Generate leads
Your goal also affects which numbers you should pay attention to.
For example, if your main goal is generating enquiries, likes alone don’t tell you very much.
You may want to look at:
Website visits
Contact-form submissions
WhatsApp enquiries
Phone calls
DMs
The right metric depends on what you’re trying to achieve.
Don’t Focus Only on Likes
Likes are easy to notice, but they don’t tell the whole story.
Depending on your goal, other signals may tell you more.
Saves
A save can indicate that someone found the content useful enough to come back to later.
Shares
A share can show that someone found the content useful or relevant enough to send to another person.
Comments
Comments can tell you that a topic made people want to respond, ask a question, or share their opinion.
Website Visits
Website traffic can help you understand whether your content is encouraging people to visit your site.
Enquiries
For a business, enquiries can be much more meaningful than a post simply getting a lot of likes.
The point isn’t to find one “perfect” metric.
Look at the metrics that make sense for your goal.
My Simple 5-Step Process
Step 1: List 5-10 Content Ideas
Start by writing down topics related to your business.
For a real estate business in Kannur, for example, the list might include:
Things to check before buying a house
Gated community vs independent house
Tips for first-time home buyers
Questions to ask before buying land
Common mistakes when buying property
Don’t worry about making every idea perfect.
Just get the ideas down first.
Step 2: Check Whether People Are Interested
Next, use simple tools such as Google Trends to see whether people are searching for or showing interest in certain topics.
You can compare related topics and look for patterns.
You don’t need to be an SEO expert to do this.
The basic question is simply:
“Is this something people are interested in?”
That information can help you decide which ideas are worth exploring further.
Step 3: Look at Your Previous Content
Now look at what you’ve already published.
Ask yourself:
Which posts received more saves?
Which posts received more shares?
Which topics got comments?
Which Reels were watched more?
Which blogs received more visitors?
Which posts brought enquiries?
Don’t make a decision based on just one post.
Instead, look across similar pieces of content and see whether any patterns start to appear.
Step 4: Plan Your Next Four Posts
Use what you’ve learned to plan your next few pieces of content.
For example:
Post 1 Blog
“7 Things to Check Before Buying a House in Kannur”
Post 2 Instagram Carousel
“5 Mistakes First-Time Home Buyers Make”
Post 3 WhatsApp Status
Share the blog with a short explanation and link.
Post 4 Instagram Reel
“3 Things to Check Before Buying Your First Home”
The same topic can therefore be turned into different types of content instead of starting from scratch every time.
Step 5: Review After 2–4 Weeks
Once you’ve published your content, don’t immediately decide that a topic worked or failed.
Give it some time, then look back at the results.
Ask:
What performed better?
What received more saves?
What brought website visitors?
What generated enquiries?
Which topics should I explore further?
Then use those observations when planning your next batch of content.
This creates a simple cycle:
Create → Measure → Learn → Adjust → Create again
Look for Patterns, Not One-Time Results
One post performing well doesn’t automatically mean the topic will always work.
Likewise, one post performing poorly doesn’t necessarily mean the topic was a bad idea.
There could be other reasons:
The hook wasn’t strong enough
The format wasn’t suitable
The timing was different
The content wasn’t clear
The audience wasn’t ready for it
Instead of reacting to one result, compare similar pieces of content.
For example, if three educational posts about the same type of customer problem consistently receive more saves than your promotional posts, that’s a more useful signal than one post performing well on its own.
Use Customer Questions as Data
One of the easiest sources of content ideas is your customers themselves.
Pay attention to the questions coming through:
Instagram DMs
WhatsApp
Comments
Phone calls
Emails
In-person conversations
Suppose a real estate business keeps receiving questions about home loans.
That one question could become:
A blog
Instagram carousel
Reel
FAQ
WhatsApp content
Your customers are already telling you what they want to know.
You just need to pay attention and turn those questions into useful content.
Simple Tools You Can Use
You don’t need expensive software to get started.
Google Trends
Useful for exploring search interest and comparing topics.
Instagram Insights
Useful for understanding how your Instagram content is performing.
WordPress Statistics
Useful for seeing which website or blog content is getting attention.
WhatsApp Business
Customer conversations and frequently asked questions can give you useful qualitative insights.
The important thing isn’t how many tools you use.
It’s whether you consistently learn from the information they give you.
What If a Post Performs Poorly?
Don’t immediately delete it or assume the topic didn’t work.
Instead, ask:
Was the topic relevant?
Was the opening strong?
Was the content easy to understand?
Was the format appropriate?
Was the CTA clear?
Did the post reach the right audience?
You may be able to improve the same idea simply by presenting it differently.
For example, a long educational post might not get much attention, while the same information could work better as a short Reel or carousel.
What If a Post Performs Well?
A post that performs well can give you ideas for what to explore next.
Suppose a post about:
“5 Mistakes First-Time Home Buyers Make”
gets more saves and shares than your usual posts.
You could follow it with:
“5 More Mistakes First-Time Buyers Should Avoid”
“Questions to Ask Before Buying a House”
“First-Time Home Buyer Checklist”
A detailed blog on the same topic
You don’t have to copy the original post.
Instead, look at the broader topic and find other useful questions around it.
A Simple Monthly Content Routine
You can keep the process quite simple.
Week 1
Collect content ideas and customer questions.
Week 2
Check search interest and look at previous content performance.
Week 3
Create and publish your content.
Week 4
Review the results.
Then start the process again.
You don’t need to spend hours analysing every number. A short monthly review can be enough to spot useful patterns and decide what to try next.
Data Doesn’t Replace Creativity
Data can show you what people are responding to.
But it can’t replace creativity completely.
You still need to:
Understand your audience
Tell useful stories
Create good visuals
Write clear captions
Experiment with different formats
Make your content feel human
Think of data as a guide, not a replacement for creativity.
It can help you decide where to explore, while creativity helps you decide how to present the idea.
You Don’t Need to Be a Data Analyst
You don’t need:
Python
SQL
Advanced Excel
Complex dashboards
Machine learning
to start making better content decisions.
You can begin with a few simple questions:
What did I post?
How did people respond?
What patterns can I see?
What should I try next?
That’s already a data-informed approach.
My Approach
My background in Data Analytics has influenced the way I approach digital marketing.
I like combining creativity with measurement.
Instead of creating content and stopping there, I prefer to think about the whole process:
Plan → Create → Publish → Measure → Learn → Improve
The goal isn’t to predict exactly what will happen.
It’s to make each round of content a little more informed than the previous one.
Final Thoughts
Data-driven content helps reduce guesswork and gives you a clearer idea of what is worth creating next.
You don’t need advanced tools or perfect numbers to get started. Begin with a few simple data points, test your content, pay attention to the response, and use what you learn to improve your plan each month.
Over time, the process becomes much simpler:
Create → Measure → Learn → Improve.